IDEXX Cornerstone Software
News and information

With COVID receding but demand for your services higher than ever, it’s the ideal time to benchmark how your business is currently performing and where you’d like to be at this time next year. Let’s look at three key Cornerstone reports that can help you quickly assess your practice's financial health: the Census report, Snapshot reports and the Performance Tracker.
Fun fact: when data is present in report itself, you can dive even deeper and manipulate information using reporting tools such as Excel along with pivot tables and charts.
Census report
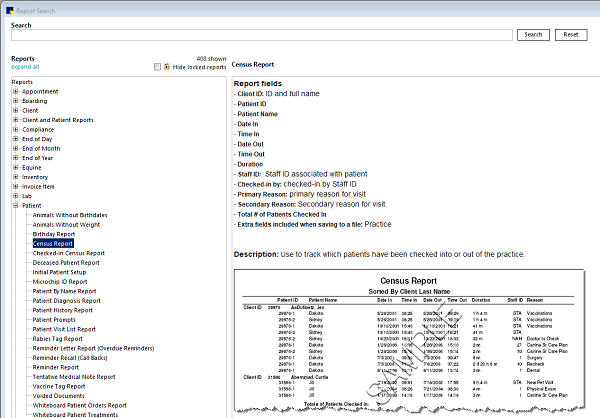
You can use the Census report to quantify appointments seen by reason and even measure appointment length. To ensure valid data, you need to be consistent in how you check patients in and out (either by posting invoice or manual check out). Run the report by date range to determine how well visit times are now compared to pre-curbside or investigate potential provider variances. Find the Census report under the Patient reporting group.
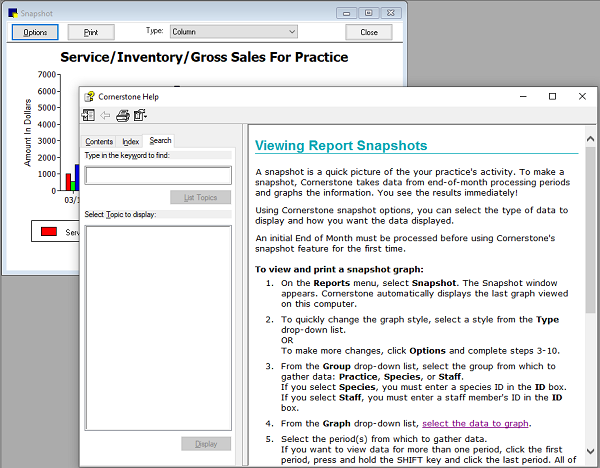
Snapshot reports
Snapshot uses end-of-month data to create a visual representation of common stats for your practice, staff, and species, like revenue month by month over time. The same SHIFT key function you use to select multiple end-of-period reports works here too. Consistency is critical: closing end-of-month on either the last business day or a designated date each month provides “equal” slices of data.
- For the practice level option, a few of the available reports include active/inactive clients, net sales/payments, number of invoices, and service/inventory gross sales.
- Some of the Staff level reports include average invoice, number of invoices, and service/inventory gross sales.
- A few of the available Species reports are average invoice, active/inactive/deceased, and number of invoices.
For a detailed list of all Snapshot reports, go to Reports > Snapshot and press F1
Performance Tracker
The Performance Tracker gives you the power to compare one period to another, whether that’s month to month, quarter to quarter, or year to year. Data is also sourced from end-of-month closes – one more reason to follow consistent end-of-month processing procedure. To select multiple consecutive periods, use the SHIFT key.
Some quick setup is needed under Practice and Workstation Defaults > Performance Tracker to ensure the correct data is included (most critical being what staff classifications to include).
![]()
Performance Tracker provides comparative data at the Summary, Doctor, Client, and Patient levels. Example data available includes gross and net sales, average invoice (gross and net), number of patients and percentage of active clients seen, sales by postal code, and much more.
This tool is best used when you can carve out some uninterrupted time, as it involves sifting through a lot of information, especially if comparing large tracking and comparison periods.
For detailed information on Performance Tracker setup and reports, go to Reports > Performance Tracker and press F1.
And a last little tip to save toner and paper:
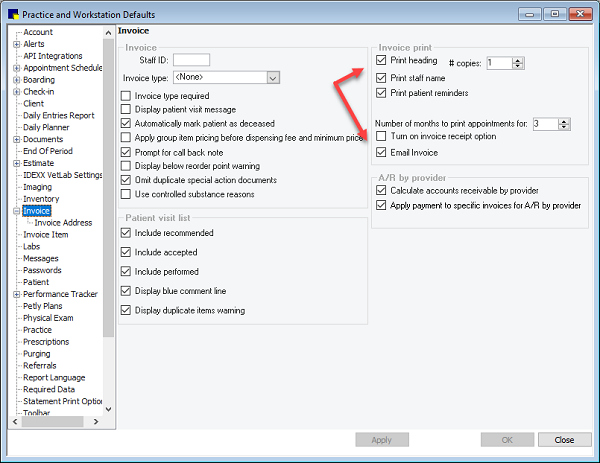
Need to default to email vs. print invoices? Simply modify your invoice defaults:
Go to Controls > Practice & Workstation > Invoice, set # copies to 0, and select Email Invoice.