Interpreting dot plots
4 easy steps to interpret dot plots and take your CBC interpretation to the next level
Numerical results are only part of the story
Dot plots provide a critical snapshot of cellular morphology and are intended to enhance the numerical results. Normal dot plots provide confidence in normal numeric CBC results. Abnormal dot plots provide insight into abnormal results; when combined with normal numerical results, abnormal dot plots may be your only indication of underlying illness. When you’re reviewing your patient’s dot plots, follow these 4 steps to determine if the dot plot results are normal or abnormal:
Step 1: Compare the dot plot provided with your results to a normal dot plot
When reviewing dot plots, it’s helpful to review them alongside a normal dot plot, available in VetConnect PLUS.
Tip: Want more normal examples than what’s shown here? The Interpreting IDEXX ProCyte Dx Hematology Analyzer Dot Plots guide is a great resource for both normal and abnormal examples of canine, feline, and equine dot plots.
To compare your dot plot to a normal dot plot in VetConnect PLUS:
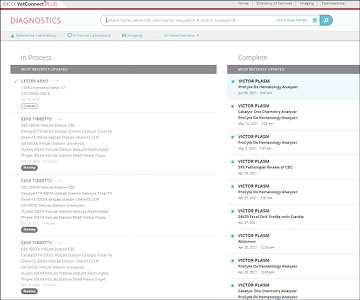
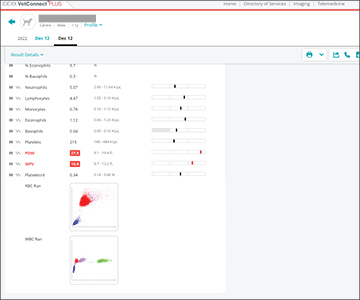
- Open the patient record, and if multiple dates are displayed, select the date for the ProCyte Dx result.
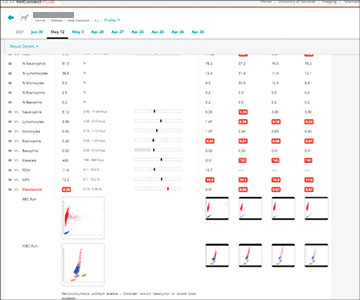
- Click the dot plot image (you may need to scroll).
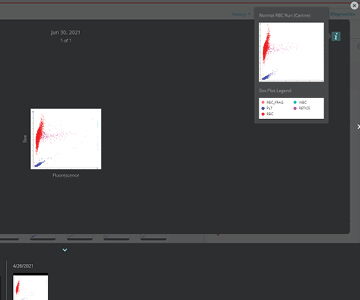
- Click the i in the top right to see a normal dot plot for comparison.
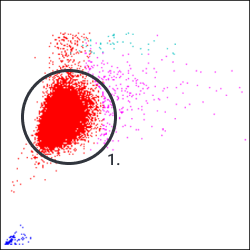
Step 2: Look for separations in the cell populations
Crowded cell populations can be caused by sample quality issues (such as clumping or hemolysis) or morphologic changes in the cells.
Dot plots enable critical evaluation of the reported CBC, turning a laborious manual differential to a visual snapshot.
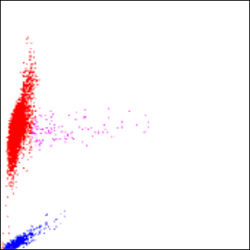
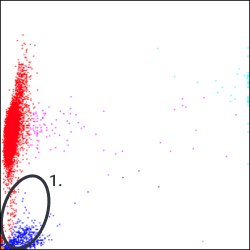
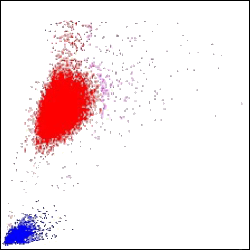
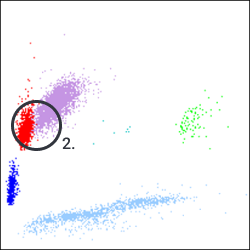
- Good separation of red blood cell and platelet populations. Clear divide between cell populations.
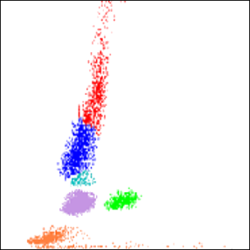
- Not a clear divide between monocytes and lymphocytes as well as lymphocytes and basophils.
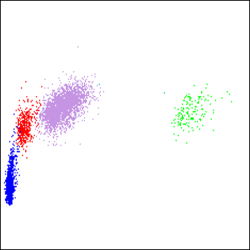
RBC dot plots
Normal canine dot plot
|
Size →
|
Fluorescence → |
Sparky, 9-year-old, neutered male Yorkshire terrier mix
|
Size →
|
|
 Fluorescence →
| Red blood cells | Platelets | White blood cells |
| Reticulocytes | RBC fragments |
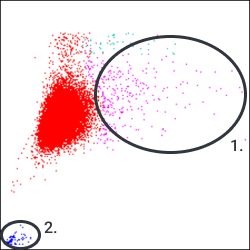
WBC dot plots
Normal canine dot plot
|
Fluorescence →
|
|
 Granularity →
Sparky, 9-year-old, neutered male Yorkshire terrier mix
|
Fluorescence →
|
|
 Granularity →
| Neutrophils | Monocytes | uRBC |
| Lymphocytes | Eosinophils | Basophils |
Step 3: Look for changes in the density of the cell populations
Are there changes in the quantity of reticulocytes and/or platelets? Are the different WBC populations increased or decreased? Are there clumped platelets?
- Decreased platelet density (may indicate thrombocytopenia).
- No reticulocyte present.
- Increased density of basophils.
- Decreased density of eosinophils.
- Presence of clumped platelets on the WBC dot plot may explain thrombocytopenia.
RBC dot plots
Normal canine dot plot
|
Size →
|
Fluorescence → |
Sparky, 9-year-old, neutered male Yorkshire terrier mix
|
Size →
|
|
 Fluorescence →
| Red blood cells | Platelets | White blood cells |
| Reticulocytes | RBC fragments |
WBC dot plots
Normal canine dot plot
|
Fluorescence →
|
|
Sparky, 9-year-old, neutered male Yorkshire terrier mix
|
Fluorescence →
|
|
 Granularity →
| Neutrophils | Monocytes | uRBC |
| Lymphocytes | Eosinophils | Basophils |
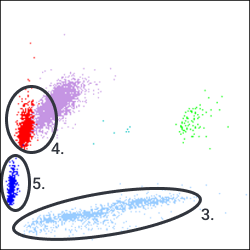
Step 4: Look for changes in the shape and location of the cells
Changes in the shape and location of cell populations may indicate changes in cell morphology that might not be evident in the numeric results. Don't overlook important clues provided in the dot plots!
- Elongation in red blood cells population suggests wider variation in RBC size (anisocytosis).
- Abnormal position of basophils population, where it is moving upward into the lymphocytes population.
RBC dot plots
Normal canine dot plot
|
Size →
|
Fluorescence → |
Sparky, 9-year-old, neutered male Yorkshire terrier mix
|
Size →
|
|
 Fluorescence →
| Red blood cells | Platelets | White blood cells |
| Reticulocytes | RBC fragments |
WBC dot plots
Normal canine dot plot
|
Fluorescence →
|
|
Sparky, 9-year-old, neutered male Yorkshire terrier mix
|
Fluorescence →
|
|
 Granularity →
| Neutrophils | Monocytes | uRBC |
| Lymphocytes | Eosinophils | Basophils |
Dot plots assist in confirmation of the numerical values of the CBC and provide insight into, and the direct assessment of, blood morphology. In this case, Sparky was newly diagnosed with diabetes mellitus and pancreatitis. Dot plots from Sparky were critical to prompting a blood film review to understand the numerical CBC findings and clinical picture, which led to a quicker diagnosis and treatment.
How can we help you with your ProCyte Dx Hematology Analyzer?
4 easy steps to interpret Procyte Dx dot plots
Interpreting IDEXX ProCyte Dx Hematology Analyzer Dot Plots
4 easy steps to interpret dot plots and take your CBC interpretation to the next level
Numerical results are only part of the story
Dot plots provide a critical snapshot of cellular morphology and are intended to enhance the numerical results. Normal dot plots provide confidence in normal numeric CBC results. Abnormal dot plots provide insight into abnormal results; when combined with normal numerical results, abnormal dot plots may be your only indication of underlying illness. When you’re reviewing your patient’s dot plots, follow these 4 steps to determine if the dot plot results are normal or abnormal:
Step 1: Compare the dot plot provided with your results to a normal dot plot
When reviewing dot plots, it’s helpful to review them alongside a normal dot plot, available in VetConnect PLUS.
Tip: Want more normal examples than what’s shown here? The interpretation guides, Interpreting ProCyte One Dot Plots and Interpreting ProCyte One Equine Dot Plots, that you received with your analyzer are great resources for both normal and abnormal examples of canine, feline, and equine dot plots.
To compare your dot plot to a normal dot plot in VetConnect PLUS:
- Open the patient record, and if multiple dates are displayed, select the date for the ProCyte One result.
- Click the dot plot image (you may need to scroll).
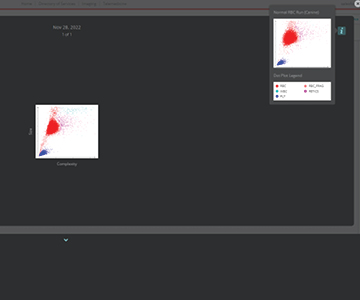
- Click the i in the top right to see a normal dot plot for comparison.
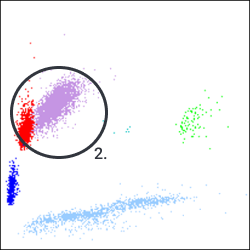
Step 2: Look for separations in the cell populations
Crowded cell populations can be caused by sample quality issues (such as clumping or hemolysis) or morphologic changes in the cells.
Dot plots enable critical evaluation of the reported CBC, turning a laborious manual differential to a visual snapshot.
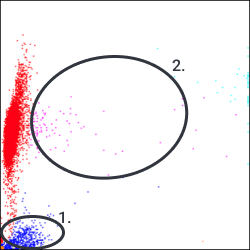
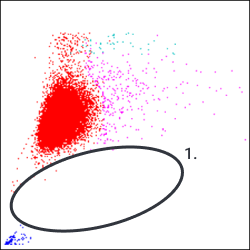
- Good separation of red blood cell and platelet populations.
- Mild crowding between monocyte and neutrophil populations (should inform interpretation of numerical results).
RBC dot plots
Normal canine dot plot
|
Size →
|
Complexity → |
Skittle, 11-year-old, neutered male Yorkshire terrier
|
Size →
|
|
 Complexity →
| Red blood cells | Platelets | White blood cells |
| Reticulocytes | RBC fragments |
WBC dot plots
Normal canine dot plot
|
Size →
|
|
 Complexity →
Skittle, 11-year-old, neutered male Yorkshire terrier
|
Size →
|
|
 Complexity →
| Neutrophils | Monocytes | Clumped platelets |
| Lymphocytes | Eosinophils | Basophils |
Step 3: Look for changes in the density of the cell populations
Are there changes in the quantity of reticulocytes and/or platelets? Are the different WBC populations increased or decreased? Are there clumped platelets?
- Increased density of reticulocytes (indicates reticulocytosis).
- Decreased platelet density (may indicate thrombocytopenia).
- Indication of the presence of clumped platelets. This may explain the apparent thrombocytopenia.
- Increased density of monocytes (may indicate monocytosis).
- Decreased density of lymphocytes (indicates lymphopenia and suggests inflammation or stress leukogram).
RBC dot plots
Normal canine dot plot
|
Size →
|
Complexity → |
Skittle, 11-year-old, neutered male Yorkshire terrier
|
Size →
|
|
 Complexity →
| Red blood cells | Platelets | White blood cells |
| Reticulocytes | RBC fragments |
WBC dot plots
Normal canine dot plot
|
Size →
|
|
Skittle, 11-year-old, neutered male Yorkshire terrier
|
Size →
|
|
 Complexity →
| Neutrophils | Monocytes | Clumped platelets |
| Lymphocytes | Eosinophils | Basophils |
Step 4: Look for changes in the shape and location of the cells
Changes in the shape and location of cell populations may indicate changes in cell morphology that might not be evident in the numeric results. Don't overlook important clues provided in the dot plots!
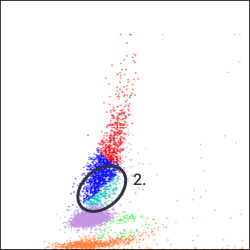
- No change in shape or location of RBC populations.
- Neutrophil population shifted left (may indicate inflammation).
RBC dot plots
Normal canine dot plot
|
Size →
|
Complexity → |
Skittle, 11-year-old, neutered male Yorkshire terrier
|
Size →
|
|
 Complexity →
| Red blood cells | Platelets | White blood cells |
| Reticulocytes | RBC fragments |
WBC dot plots
Normal canine dot plot
|
Size →
|
|
Skittle, 11-year-old, neutered male Yorkshire terrier
|
Size →
|
|
 Complexity →
| Neutrophils | Monocytes | Clumped platelets |
| Lymphocytes | Eosinophils | Basophils |
Dot plots assist in confirmation of the numerical values of the CBC and provide insight into, and the direct assessment of, blood morphology. In this case, Skittle was under treatment for immune-mediated thrombocytopenia (ITP). Dot plots from Skittle were critical to prompting a blood film review to understand the numerical CBC findings and clinical picture, which led to a quicker diagnosis and treatment.
How can we help you with your ProCyte One Hematology Analyzer?
4 easy steps to interpret Procyte One dot plots